Genetics, populations, evolution and ecosystems (AQA A2 Biology) PART 4 of 4 TOPICS
|
Populations in ecosystems:
Populations of different species form a community within a habitat. The community together with non-living features (known as abiotic conditions) which include temperature and water form a community. Ecosystems can vary in size from small e.g. a garden of a property to large ecosystems e.g. rainforest.
Within a habitat each organism has a different niche (the role of a species within a habitat). The niche a species can occupy includes:
- Its biotic interactions (living features): What it eats and what it is eaten by.
EXAMPLE: Sea otters have to smash clams and shellfish open with rocks.
- Its abiotic interactions: The oxygen that the organism inspires and the CO2 it expires.
EXAMPLE: Otters have webbed paws which means they can walk both on land and swim.
An ecosystem supports a certain size of a population of a species which is called the carrying capacity. This population size can vary as a result of:
- The effects of abiotic conditions: If temperature, light, water or other abiotic factors fall it means that the reproduction and growth rate will be low.
EXAMPLE: When a temperature of a mammal’s environment is ideal for the metabolic reactions to occur, it means that they do not have to use much energy to maintain a constant body temperature therefore the energy can be used for growth and reproduction therefore increasing the size of the population.
- The effects of biotic conditions: There are two types of competitions and predation that you need to know:
- Interspecific competition: This is competition between different species for the same resources such as food and space. As the food in this case would not be available totally to one species, the availability for food to both species will be lower causing them to have less energy for growth and reproduction therefore making both the populations lower for both species. In some cases one species may be better adapted than the other making the species that is stronger more likely to survive and reproduce passing on the advantageous alleles to the offspring causing the allele frequency to increase.
- Intraspecific competition: This is competition within a species for the same resources:
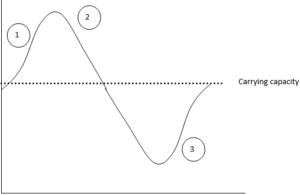

1 = The population of a species increases when there are plenty of resources available for each individual.
2 = Eventually resources start to run out therefore competition is on the rise and the population starts to decline as the weaker ones are out-competed.
3 = The population starts to increase after it has been at its lowest point as there is less competition and resources start to become available to everyone.
- Predation: Predator and prey populations are linked to each other. As one changes it causes the other to change as shown below:
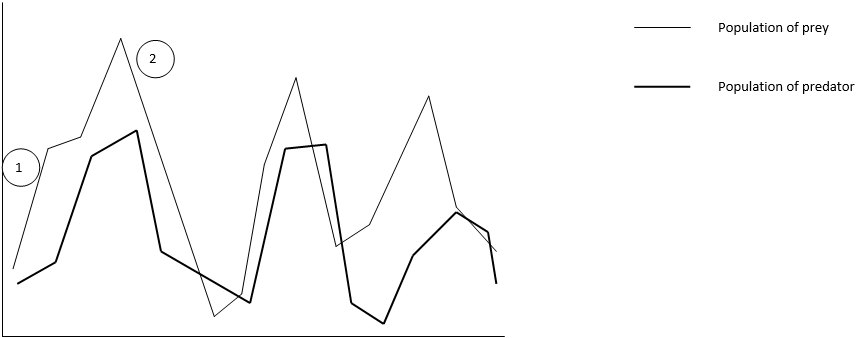
NB: The population of the predators is always below the prey because of the energy levels in the food pyramid. Prey have more energy than predators. This graph is based on the fact that the predator only eats the prey shown in the graph and nothing else.
1 = The prey population increases causing the predator population to increase too as there is more food available for the predators.
2 = This reduces the amount of prey for the predators therefore the population of the prey decreases causing the predator population to decrease.
The size of a population can be estimated using:
- randomly placed quadrats or quadrats placed along a belt transect for slow-moving or non-motile (do not move) organisms:
EXAMPLE FOR RANDOMLY PLACED QUADRATS: If a quadrat with dimensions 0.5m by 0.5m was used then it would have an area of 0.25m2. Percentage cover is then worked out by counting the squares which is half filled or over with the species you are investigating. There are usually 100 squares in a quadrat making the number of squares the percentage cover. If there are not then you will need to get the number of squares that have the species divided by the total number of squares in the quadrat and multiply it by 100.
EXAMPLE FOR QUADRATS PLACED ALONG A BELT TRANSECT: In belt transects, quadrats are placed next to each other along the transect to work out species frequency or percentage cover. The quadrats do not have to be placed next to each other but can be placed at intervals which is known as an interrupted belt transect.
- the mark-release-recapture method for motile (moving) organisms:
EXAMPLE: A group of scientists wants to find the total population of the Violet Turaco, a native bird of Ghana.
To do this capture the birds in the most appropriate, safe, ethical and harmless way. Mark them also in the most appropriate, safe, ethical and harmless way e.g. put a tag on them that will not affect their behaviour and roaming, record the number and then release them back into their habitat. Wait for a week or for how long you want making sure that you do not wait too short or too long and then return to the same population to count how many birds you recapture with a mark you left on them and also other birds of the same species without the mark. (You should have three sets of data which are number caught the first time and marked, number caught the second time just with the same mark you left on them and the total number caught the second time with a mark you left and without the mark). Once your data is obtained you use the equation below to work out the total size of the population:
Where T is the total size of the population of a species, N1 is the number caught the first time and marked, N2 is the total number caught with a mark and without the mark and mN2 is the number caught the second time with just the mark you left on them.
When using the mark-release-recapture method there are a few assumptions which include that the marked sample has had enough time and opportunity to mix back in with the population hence why in the method you should wait not too long and not too short,; the markings do not affect the species chances of survival but the marking should still be on the individuals when you return the second time hence why the markings should be appropriate, safe, ethical and harmless to the species, and; there should be no changes in the population size due to births, deaths and migration during the time of study hence why you should not wait too long for the second capture.
Ecosystems are dynamic systems meaning they are constantly changing.
Succession is the process where an ecosystem changes overtime. NB: There are two types of succession being primary and secondary but only primary succession needs to be known. Primary succession starts with a species colonising the new land where these species are known as pioneer species – an example of pioneer species is lichen which you may have heard in GCSE. Lichen is an organism which is in between a plant and a fungus. This succession takes place on newly formed or land without soil where the abiotic conditions are harsh. Pioneer species start to grow as they are adapted to hostile abiotic conditions and eventually change them to become less hostile by dying and getting decomposed to make basic soil. This soil helps to retain water therefore changing the abiotic conditions. The change in the conditions causes new species such as grass and small plants with adaptations being similar to the conditions to grow. These new species then die and are decomposed making the abiotic conditions much more friendly as more organic matter (humus) is added making the soil more richer in minerals. The soil can now retain even more water helping larger species such shrubs and hedges to be grown. In some cases the new species causes the abiotic condition s to be less suitable to the pioneer species. An example of this would be that sand sedges stabilise in the sand by the use of rhizomes (an underground stem). This is not convenient for marram grass as they need constant reburial by sand in order to grow healthy therefore these start to die. Shrubs begin to grow and become the dominant species where diversity increases. The final stage comes; large trees start to grow and a climax community is established where the ecosystem is supporting the largest and most complex community of animals and plants. This will not change as it is in a steady state.
NB: Only a few details of secondary succession need to be known. Secondary succession takes place on land which has soil and the pioneer species are bigger.
Conservation, the protection and management of ecosystems, helps maintain the habitats by preventing succession in order to keep it at its current stage. Maintaining the number of habitats saves the animals and plants that live in the area. There are a couple of ways to carry out conservation:
- Grazing: The animals grazing have a similar effect to mowing a garden. The animals eat newly growing shoots of shrubs preventing them from establishing themselves to keep the vegetation low.
- Managed fires: These fires are lit for secondary succession. The first species to grow (pioneer species) are conserved. Larger species will establish themselves again and are removed when the next fire is lit.
Some conservation plans do not just protect habitats but may protect species too:
- Seedbanks: These are stores of a vast amount of seeds from a variety of species. If a population of a certain species of plants become extinct conservationists can bring them back by planting the stored seeds.
- Fishing quotas: These are limits as to how much of a certain type of fish can be caught. This can also be done by having nets which have large holes so that young offspring can be left in the water for breeding can catching fish in a certain cycle allowing time for the population to grow.
- Protected areas: These are areas such as national parks and natural reserves where urban development industrialisation and farming are restricted to protect the wildlife and their habitats.
- Endangered species: These are species that have a low population due to overhunting, natural disaster or disease. These organisms are bred in captivity such as zoos to raise the numbers and are then returned to the wild.
However not everyone agrees with every conservation plan and measure that is carried out as there often conflicts between human needs and conservationists. Therefore careful management is needed to find the balance between the two so that there is sustainability of natural resources. An example of this would be the Maasai Mara in Kenya where the Maasai people overgraze their cattle to earn a living therefore conservationists need to step in to protect the natural reserves causing conflict.
Evaluating evidence and data about conservation issues:
NB: You need to know this for the exam.
EXAMPLE: Otters make a comeback. In the 1950s and 1960s there was a dramatic decline in the otter population. Removal of vegetation from riverbanks wiped them out in almost all of the Midlands and South-East England. In the 1990s the government, through conservation organisations such as local wildlife trusts, carried out a number of ambitious projects designed to restore otters to all rivers where they existed before the 1950s. An experiment was carried out over 15 years to see what would happen to the population of otters if the vegetation on the riverbanks increased. A controlled group was also used with the same species of otter living in the same habitat but under the normal conditions i.e. the vegetation was left and not changed. The graphs shows the results: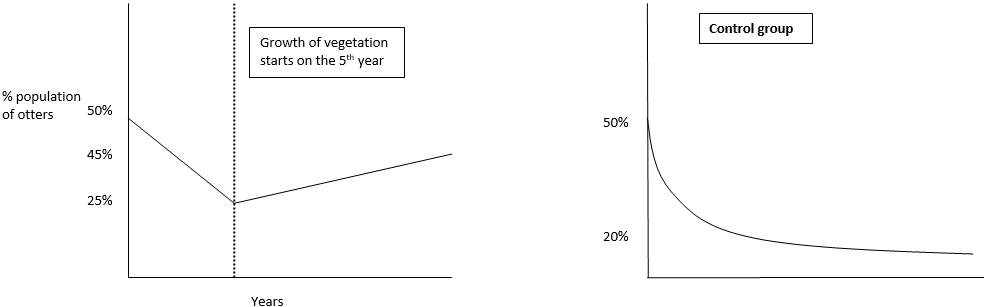
NB: You may be asked to interpret and analyse the data.
- Describe the data:
- For the first five years the population of otters decreased from 50% to 25% with a steep gradient. After vegetation started to grow in the fifth year, the population of otters started to increase but with a shallow/small gradient.
- The control group experienced a steady decline in the percentage of otters for the whole of the 15 years where there was a drop from 50% to 20%
- Draw up conclusions:
- The results of both the groups together show that an increase in vegetation has caused an increase in the population of otters. This suggests that in the 1950s and 1960s the otters lost food, habitats and materials which helped them to survive and reproduce.
- Evaluate the method:
- The effects of other variables such as changing temperatures were removed so that the validity of our results increases.
- The study area and sample was large to further increase the validity of the results.
- Random sampling removed biasness – the data is more likely to be an accurate estimate of the whole area.
Some experiments show conflicting evidence. If the above experiment was to be carried out in another area but of the same land with a smaller sample size and no control group, it would not be enough to say that vegetation is the cause of the decline o the otters. This is because the control group provides evidence that under normal condition the otters are declining and that increasing the vegetation has an affect on the otter numbers. With no control group it may show that another factor is involved in increasing the population. This experiment may be that there was no control group and the experiment’s results showed that vegetation is not the answer to increase the population as the population continued to decrease after vegetation started to increase.